Every neighborhood deserves to know what's in its water.
From watershed to kitchen tap — Aquifer traces the invisible journey and translates hydrology science into action your block can use.
The water reaching your tap begins thousands of miles away.
Click any region to see the current water quality status, active concerns, and the Aquifer research teams on the ground.
Great Lakes Basin
watersheds
Current ConcernLegacy lead service lines in 67 cities — pipe replacement at 34% completion
From mountain snowmelt to morning glass — how far has your water traveled?
The path between a clean source and a safe tap is longer, more fragile, and more political than most people realize. Aquifer maps every step.

Watershed Collection
Rain and snowmelt gather contaminants as they travel across agricultural land, urban surfaces, and industrial sites before entering rivers, lakes, and aquifers.
Aquifer monitors 847 collection points across national watersheds, tracking seasonal variation in nitrates, heavy metals, and emerging contaminants like PFAS.
"The watershed doesn't know where the city limits are. Contamination doesn't either."

Treatment & Processing
Water passes through coagulation, sedimentation, filtration, and disinfection. Each stage removes specific contaminants — but aging infrastructure creates gaps.
The average US water treatment plant is 45 years old. Aquifer's infrastructure audit found 31% of facilities operating beyond their designed lifespan.
31% of facilities past designed lifespan
"Treatment technology has advanced. The pipes carrying treated water often haven't."
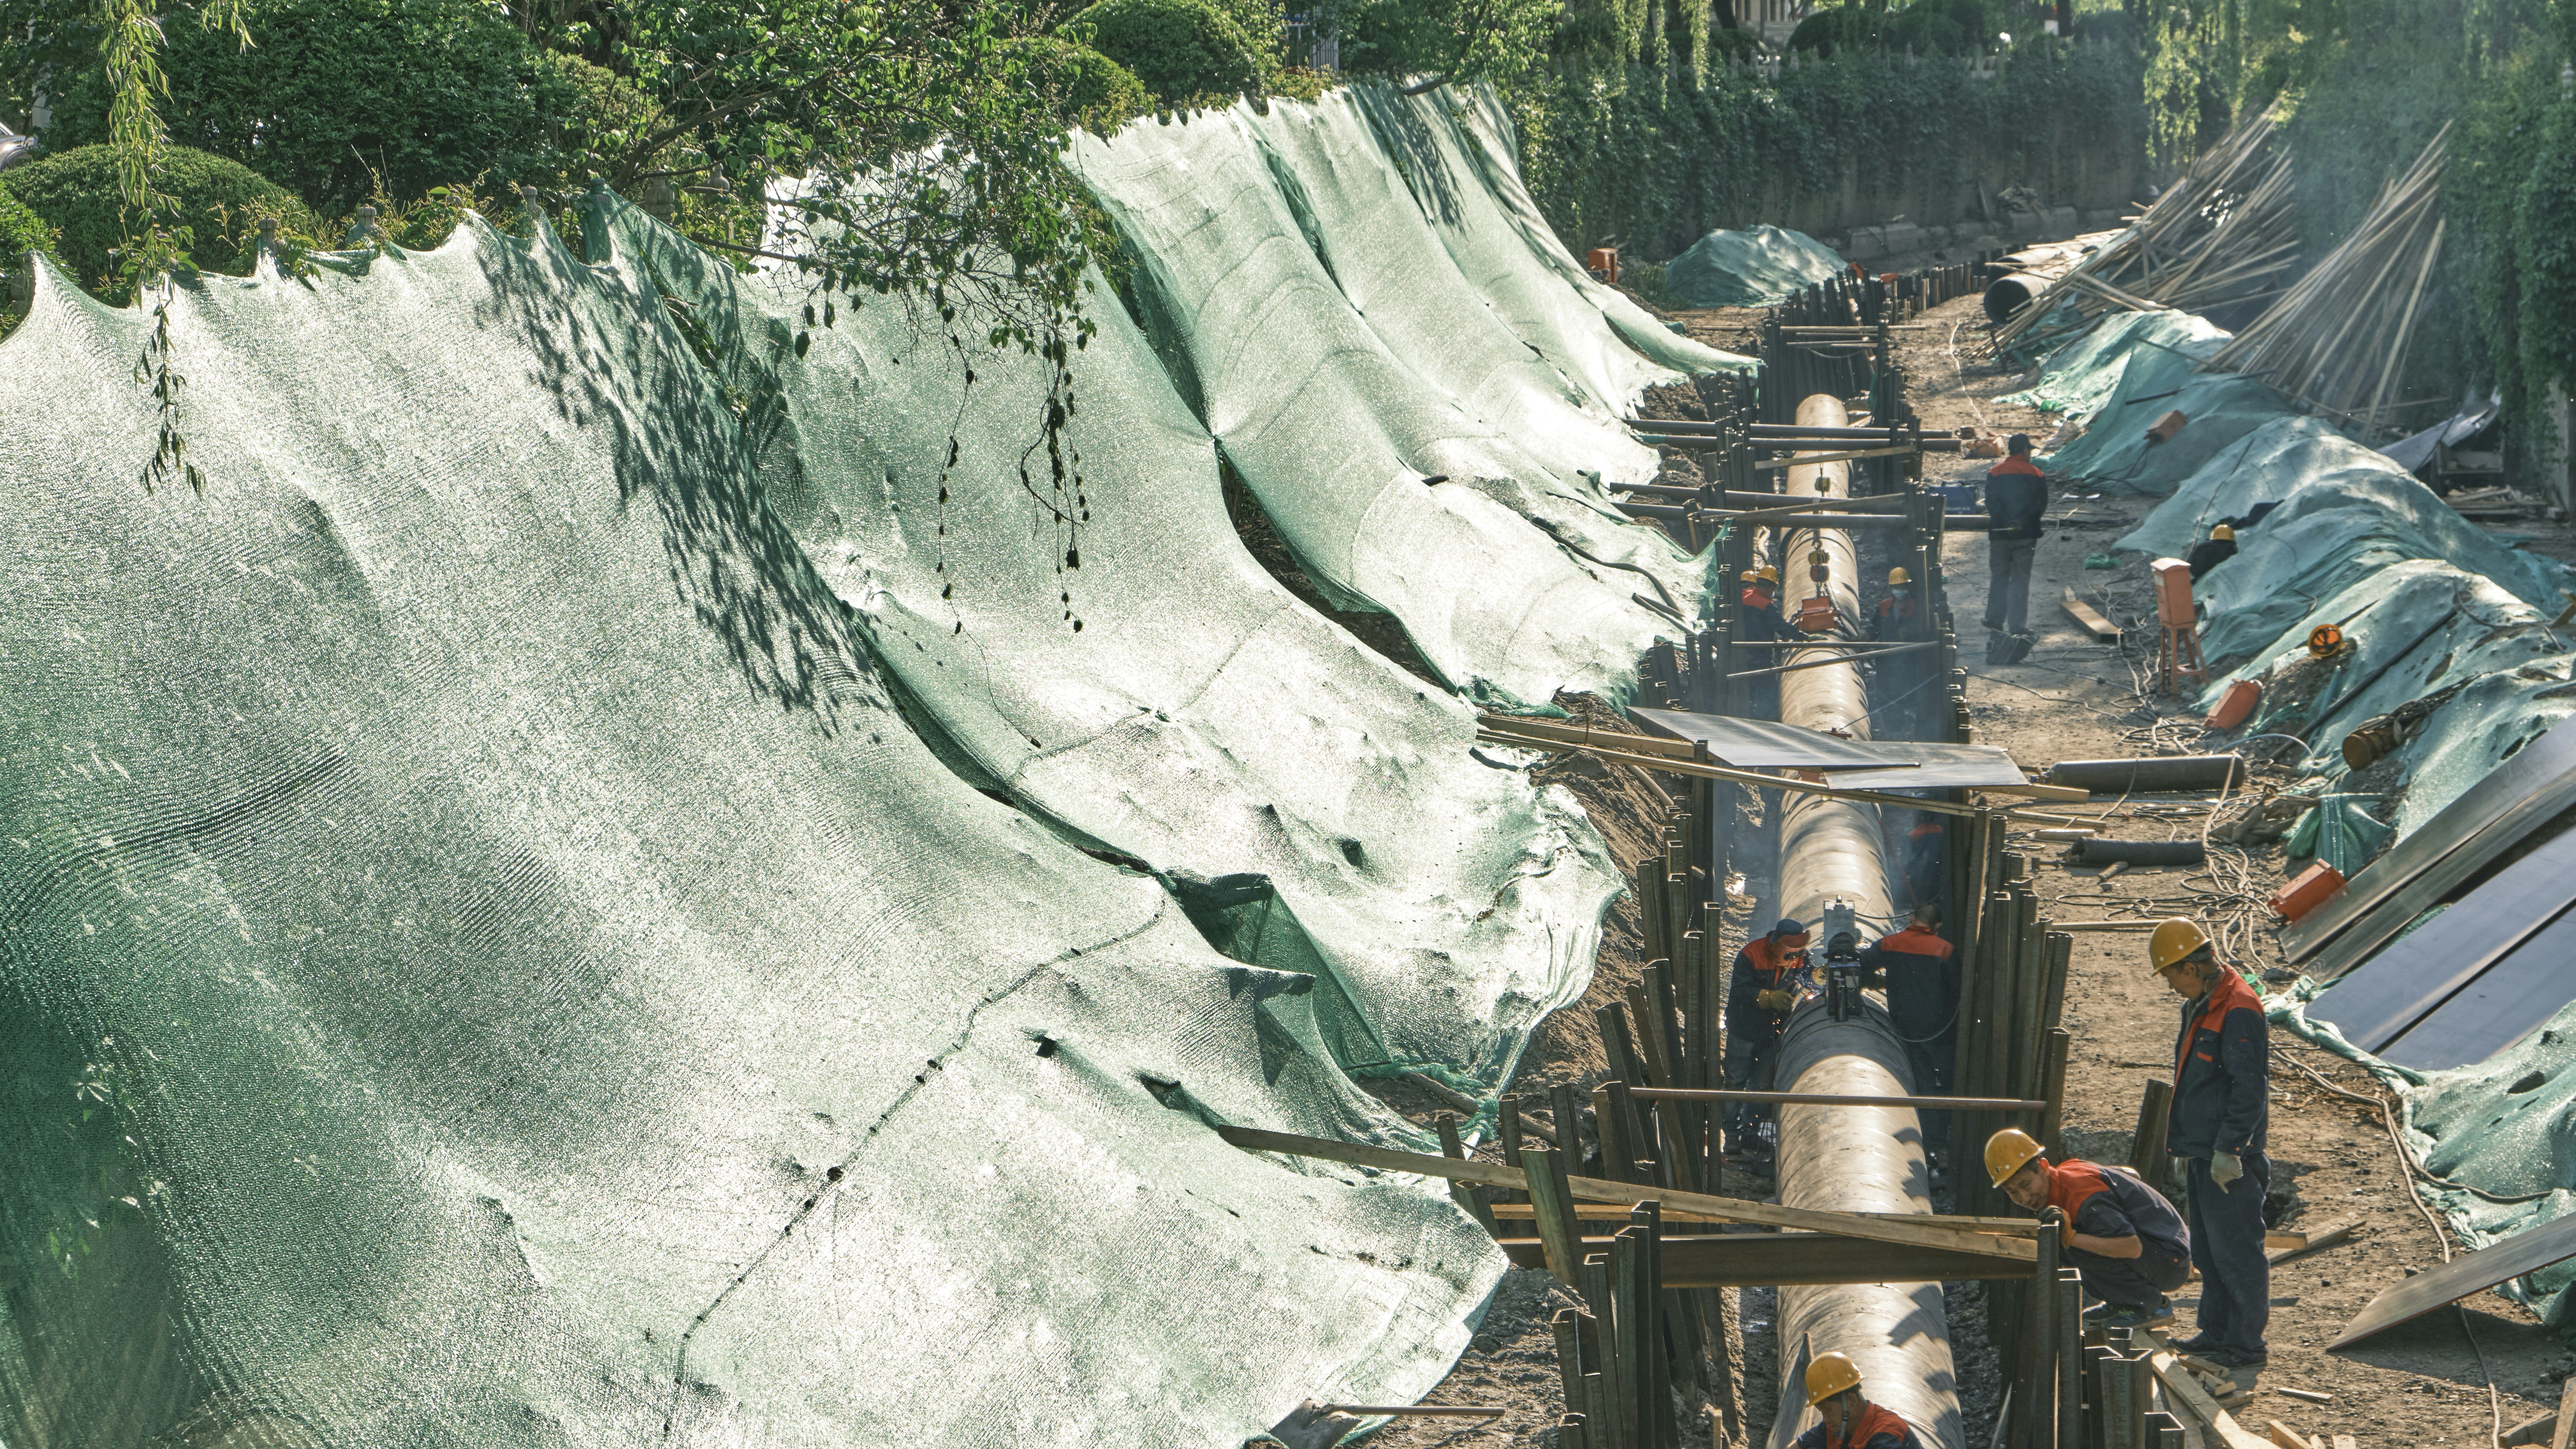
Distribution Network
Water travels through thousands of miles of pipes — some dating to the 1920s — before reaching homes. Lead service lines remain the most acute equity issue in water safety.
An estimated 9.2 million lead service lines still connect homes to water mains. Replacement costs average $4,700 per line. Aquifer's equity mapping shows 73% are in census tracts below median income.
73% in below-median-income tracts
"Lead pipes are not a legacy problem. They are a present crisis in 9.2 million homes."
Treatment Stage Diagram
* Each transition point is a potential contamination risk. Aquifer tests at all 6 stages.
Flint's East Side, 2021–2024: What the data actually showed.
Aquifer partnered with the Flint River Watershed Coalition and the City of Flint Water Department to produce the first block-by-block contaminant timeline — the data that drove $47M in targeted pipe replacement.

Contaminant Levels
"The data existed. It just wasn't in a form anyone could testify with."
When community organizer Daria Coleman walked into the Flint city council chamber in March 2022, she carried a single Aquifer report: 14 pages, block-by-block, with every lead reading mapped to a home address and an income level.
The council approved the $47M emergency remediation package four weeks later. The data hadn't changed. The format had.
"When you show a council member that 68% of the homes above the lead limit are in one zip code, the conversation about equity stops being abstract."
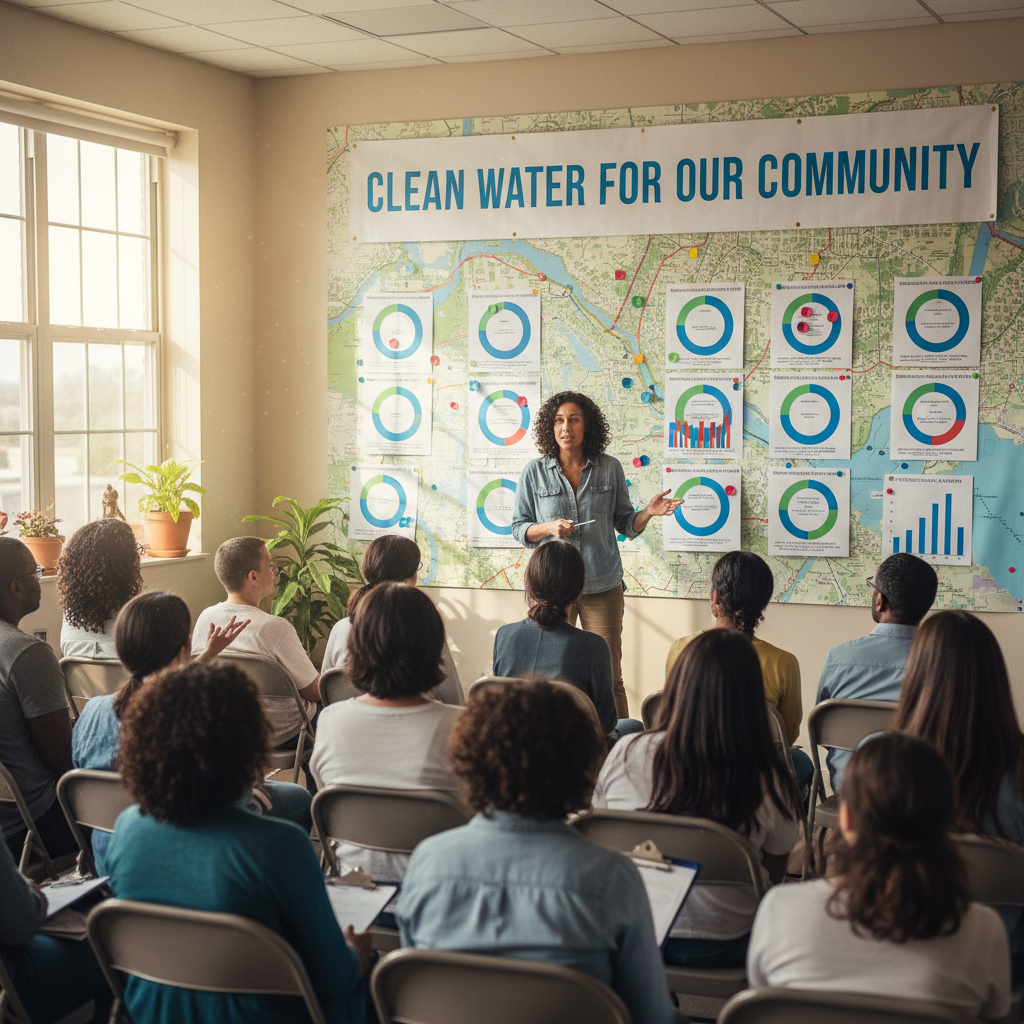
Your neighborhood has data like this.The Aquifer Water Quality Explorer shows you every test result from your zip code — in plain language, with context.
Check Your Neighborhood's WaterPeer-reviewed science. Named researchers. Real accountability.
Every Aquifer publication carries the name and institutional affiliation of its lead researcher. No anonymous reports. No industry funding without disclosure. The data is only as trustworthy as the people behind it.

Dr. Priya Nair
Chief HydrologistMIT Environmental Solutions Initiative
"The data has always been there. We built the tools to make it speak to a neighborhood."

Marcus Webb, P.E.
Infrastructure Policy LeadColumbia Water Center
"Every pipe has a history. Most water departments don't have the staff to read it."

Elena Vásquez, J.D.
Environmental Justice DirectorYale School of the Environment
"The zip code you're born in shouldn't determine whether your water is safe."
Municipal Outcomes
2021–2024Lead pipe replacement
Emergency remediation funded after Aquifer block-level mapping
Filter distribution program
Households reached with certified filters within 60 days of Aquifer report
Federal intervention
Infrastructure bill prioritization supported by Aquifer infrastructure audit
PFAS mitigation
Industrial discharge points identified and enforcement actions initiated
Research supported by

What's actually in your neighborhood's water?
Enter your zip code to see every test result from your water system — lead levels, PFAS readings, nitrate measurements — translated from regulatory language into plain English, with context for what it means for your household.
Data sourced from EPA SDWIS, state DEQ databases, and Aquifer field testing. Updated quarterly.
Download the 2026 State of America's Drinking Water
94-page policy brief · PDF · Free
The definitive annual assessment of US drinking water quality — written for policymakers, foundation officers, and municipal directors who need peer-reviewed data in actionable form.
Need data formatted for testimony?
Aquifer produces testimony-ready one-pagers for any zip code — formatted for city council submissions, EPA comment periods, and foundation grant applications.
Request a community report